
Apple is approaching an interesting point.
The business continues to produce strong growth, exceptional cash flow, high margins, and some of the most durable ecosystem economics in public markets.
The stock is also trading in a strong multi-timeframe uptrend.
But at current prices, the harder question is no longer whether Apple is a high-quality business.
It is whether the market is already pricing in too much of that quality.
This Market Note looks at both sides of the equation:
what the stock is doing,
what the business is doing,
and what would have to change for either view to weaken.
Technical Analysis
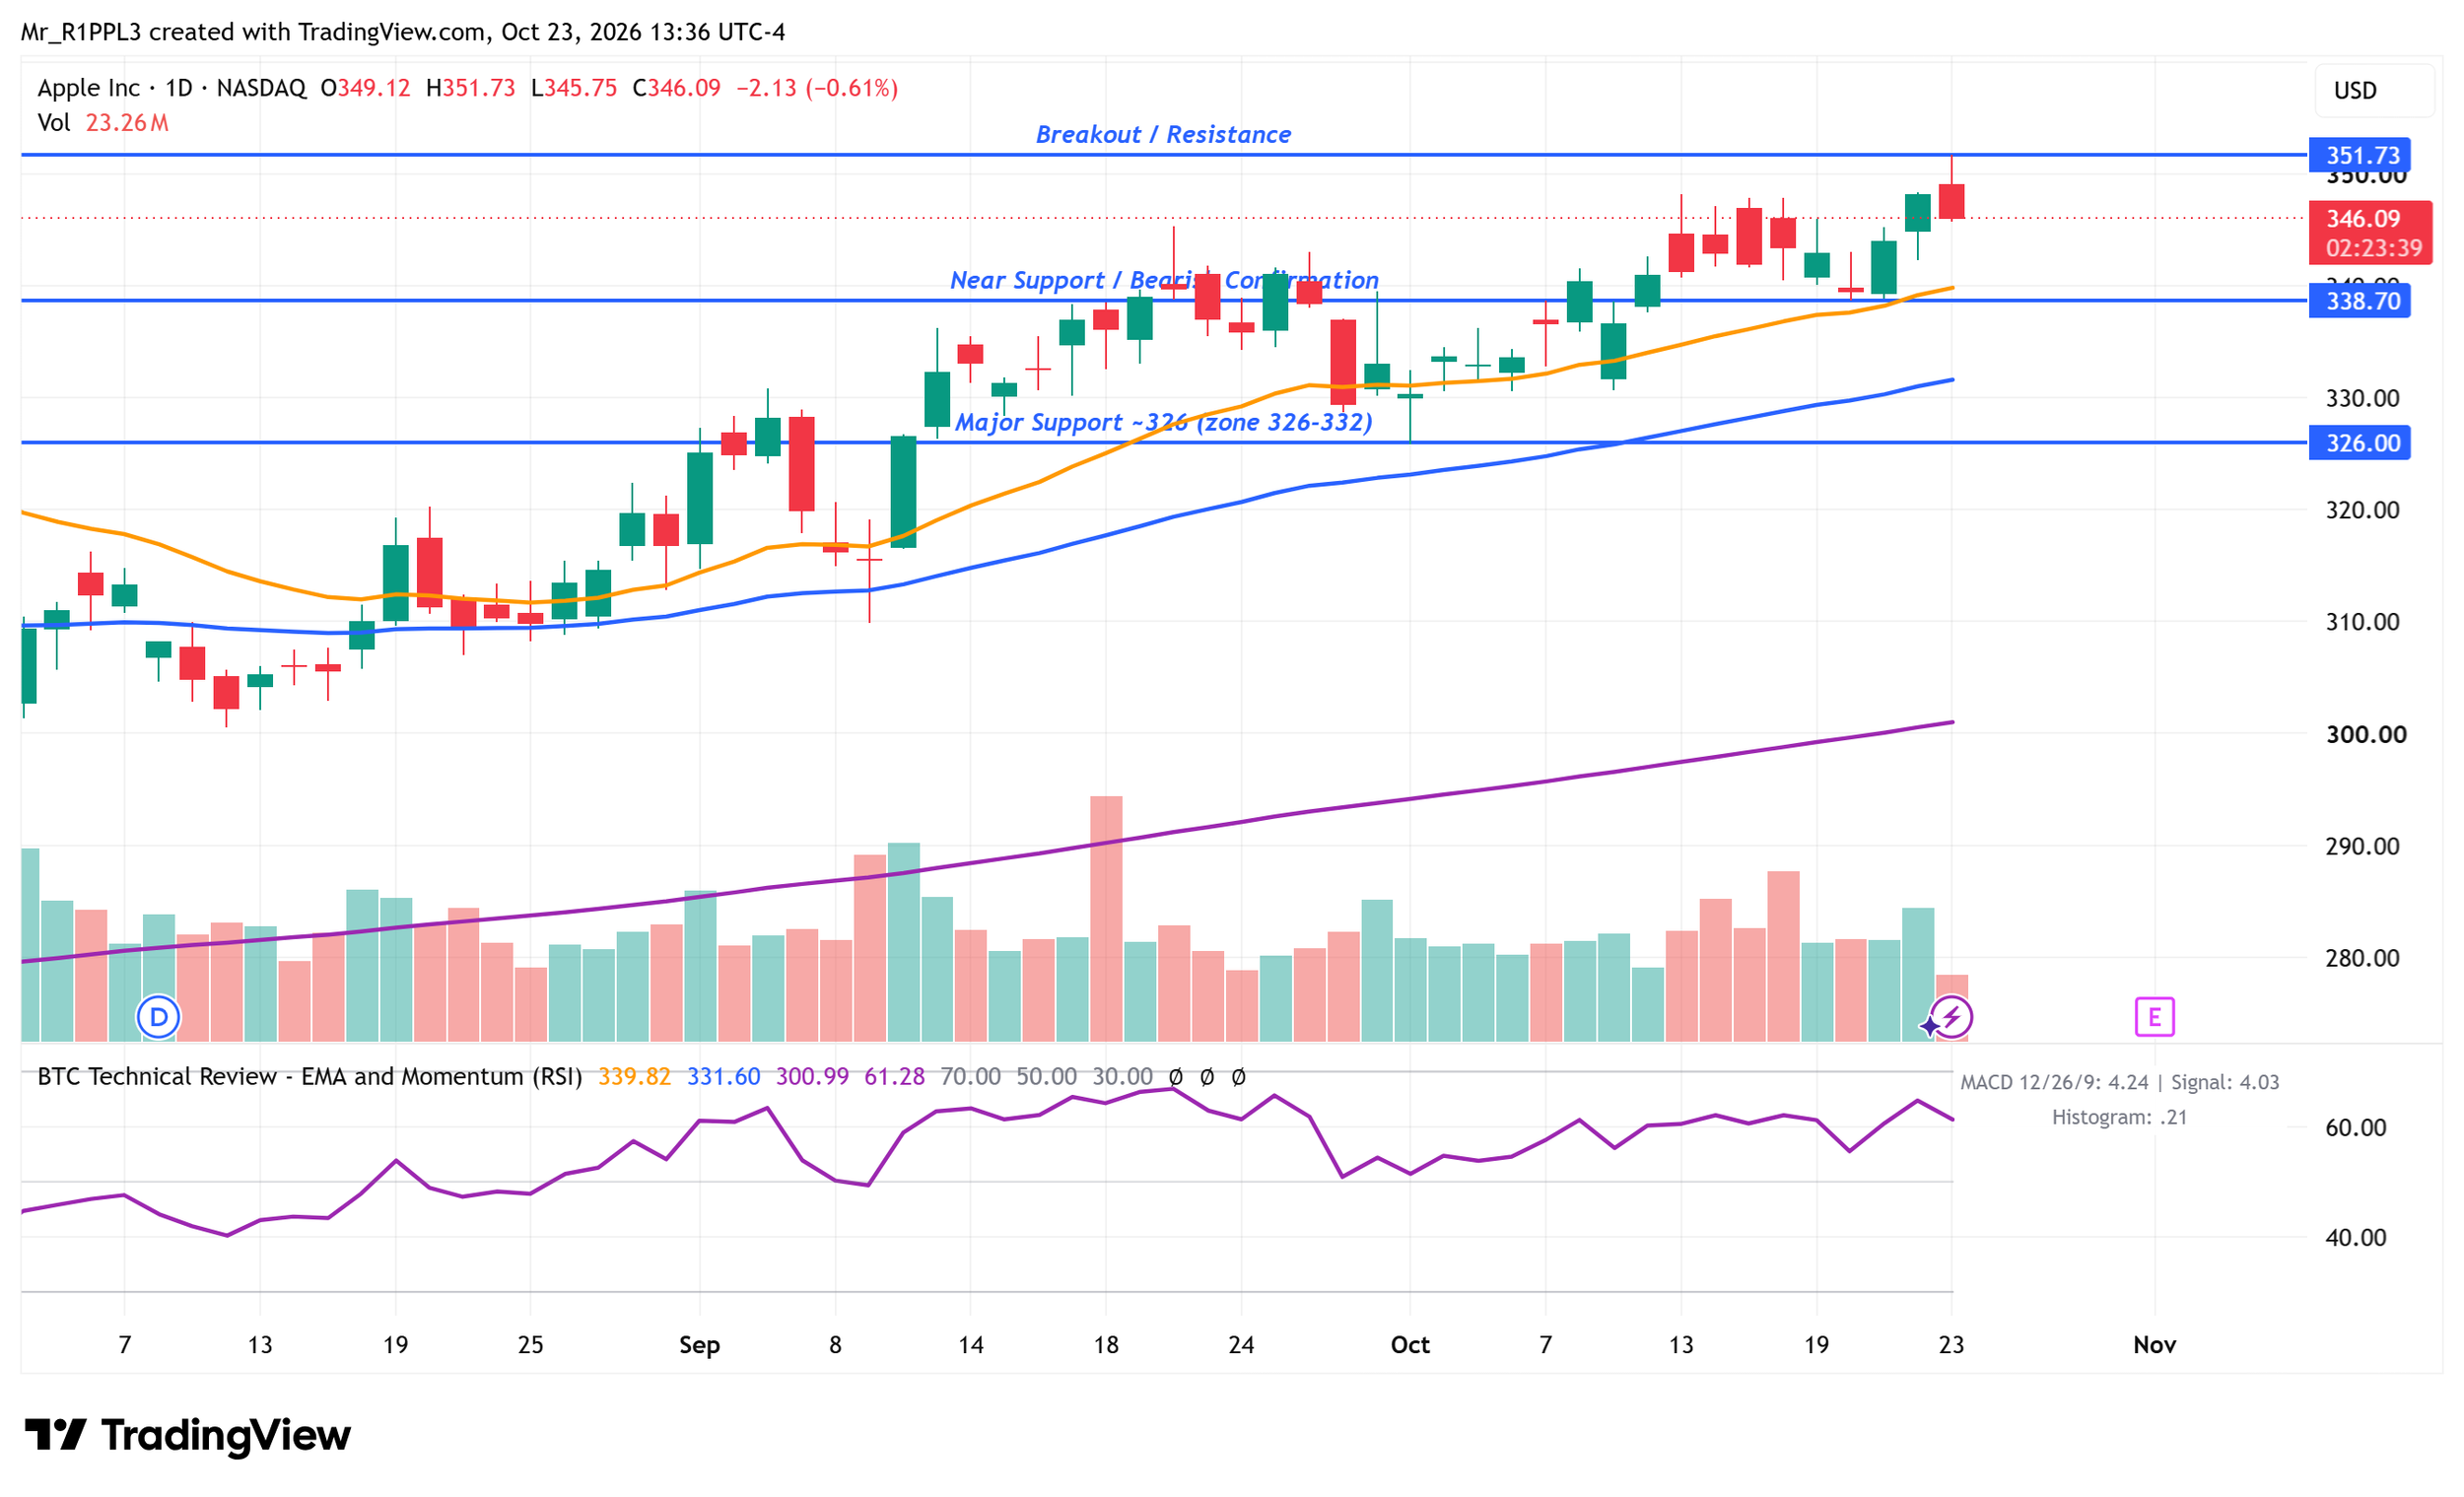
At approximately $346, Apple remains above its major moving averages across the four-hour, daily, and weekly charts. The 4H trend is bullish but consolidating beneath resistance. The daily trend is bullish with momentum caution, and the weekly trend is bullish.
Levels that matter
- Immediate support
- $340–$343
- Structural support
- $338.70
- Major support
- $326–$332
- Immediate resistance
- $348–$350
- Major resistance
- $351.73
- Near-term decision level
- $338.70
Breakout confirmation requires a completed daily close above $351.73 followed by a successful retest. Bearish confirmation would be a sustained loss of $338.70 followed by a failed reclaim. Neither has been established by this snapshot.
Moving averages and momentum
4H: 20 EMA $342.93; 50 EMA $338.36; 200 EMA $319.78. RSI (14): 58.98.
Daily: 20 EMA $339.82; 50 EMA $331.60; 200 EMA $300.99. RSI (14): approximately 61.
Weekly: 20 EMA $321.63; 50 EMA $295.40; 200 EMA $231.49. RSI (14): 66.63.
MACD is above its signal on all three timeframes, with modest positive histograms. Volume is mixed, without completed breakout-volume confirmation. The alignment supports the trend; it does not establish that resistance has already been overcome.
A bullish trend testing an unresolved resistance level.
Fundamental Analysis
Apple’s current fundamental picture remains strong. Q3 FY2026 revenue was $109.417 billion, up 16% year over year. iPhone revenue was $54.252 billion, up 22%; Mac revenue was $10.352 billion, up 29%; and Services revenue was $30.739 billion, up 12%. Nine-month total revenue reached $364.357 billion.
The Ecosystem Remains the Core Advantage
We view Apple’s advantage as the combined ecosystem: iPhone, Mac, iPad, Apple Watch, AirPods, iCloud, payments, subscriptions, the App Store, and other Services tied together through operating-system integration.
That combination can make everyday use more convenient and switching more disruptive. Brand, retention, and the installed base provide opportunities for recurring monetization. The investment case depends on customers continuing to value that experience. Switching costs are meaningful, but they are not impossible to overcome.
Services Continue to Improve the Business Mix
Services generated $30.739 billion in Q3 and $91.728 billion over nine months. Its higher-margin economics and recurring elements help monetize the installed base and reduce dependence on hardware unit growth alone. This makes the quality of that growth important: durable customer value matters more than simply expanding fees.
Margins Were Excellent — With an Important Qualification
Company gross margin was 50.1%. Apple’s Q3 earnings release states that tariff refunds contributed approximately 2 percentage points. Diluted EPS was $2.02, up 29%, including approximately $0.11 from those refunds.
Investors should not treat all of the reported margin benefit as recurring operating improvement. The underlying business can be strong while a portion of a quarter’s reported strength is temporary.
Cash Generation Remains Exceptional
Nine-month operating cash flow was $116.996 billion, against $6.799 billion of property, plant and equipment purchases.
Free cash flow, calculated as operating cash flow less property, plant and equipment purchases:
$116.996B − $6.799B = $110.197B.
This is our calculation, not a GAAP line item reported by Apple. For FY2025, the same definition gives $111.482B − $12.715B = $98.767B. For the first nine months of FY2025, it gives $81.754B − $9.473B = $72.281B.
The calculated trailing-twelve-month estimate through June 27, 2026 is therefore:
$98.767B − $72.281B + $110.197B = $136.683 billion, or approximately $136.7 billion.
Capital Allocation and Per-Share Value
Nine-month cash repurchases were $62.094 billion. Repurchases recognized in shareholders’ equity were approximately $62.242 billion over nine months, including $25.949 billion in Q3. Cash-flow-statement and equity-statement repurchases can differ because of timing and accounting presentation; they should not be used interchangeably.
Shares issued and outstanding were 14.608963 billion on June 27, 2026 and 14.594180 billion on July 17. A declining share count can improve per-share economics, provided repurchases do not impair investment in the business or financial flexibility.
Buybacks create more value when shares are repurchased at attractive valuations.
Balance Sheet Strength
At June 27, cash and cash equivalents were $39.544 billion, current marketable securities $22.855 billion, and non-current marketable securities $84.118 billion. Together, these total $146.517 billion.
Commercial paper was $1.997 billion. Current term debt was $11.007 billion and non-current term debt $71.340 billion, totaling $82.347 billion of term debt. Apple retains substantial liquidity and financial flexibility, but it is not debt-free.
Artificial Intelligence
Apple’s Q3 release highlights Siri AI and an installed base at an all-time high. The potential advantage is integration across devices and operating systems, supported by the company’s privacy positioning. Capability and distribution, however, are different from proven monetization.
The investment question is whether Apple can translate AI capability into stronger economics. That could come through more useful devices, faster replacement cycles, deeper ecosystem retention, or new Services opportunities. It could also create competitive risk if other platforms use AI to reduce the advantages of Apple’s ecosystem. These outcomes should be judged against product adoption and financial results rather than assumed in advance.
China Remains Both Opportunity and Risk
Q3 Greater China revenue was $18.816 billion, up 22% year over year. Nine-month revenue was $64.839 billion. The region offers a large customer base and strong recent growth.
One strong quarter does not eliminate structural exposure to geopolitics, manufacturing concentration, suppliers, regulation, or domestic competition. Demand and supply-chain resilience both matter.
Regulatory Risk
Apple’s filings describe litigation and regulatory scrutiny involving App Store rules, payments, platform access, and competition policy. Restrictions on commissions or requirements for alternative distribution and interoperability could affect Services economics and product design.
The timing and outcome remain uncertain. The investment question is how much enduring economic value Apple can retain as those rules evolve.
Valuation
The following calculations use the supplied October 23, 2026 reference price of $346.12. They are historical estimates, not live quotes or company-reported valuation metrics. The exported chart captures a slightly different moment at $346.09.
Trailing Earnings and P/E
Estimated trailing diluted EPS: FY2025 $7.46 − nine-month FY2025 $5.62 + nine-month FY2026 $6.88 = $8.72. Combining reported period EPS is an approximation because weighted-average share counts and rounding can differ.
Calculated trailing P/E: $346.12 ÷ $8.72 = 39.7×, or approximately 40× trailing diluted earnings.
That multiple reflects not only current earnings power, but also expectations for continued durability, margin strength, and per-share compounding.
The calculated earnings yield is approximately 2.5%. It is simply the inverse of the P/E multiple, not a promised distribution or a direct equivalent to a bond yield.
Market Capitalization and Free-Cash-Flow Yield
Using 14.594180 billion shares outstanding as of July 17, 2026:
$346.12 × 14.594180B = approximately $5.05 trillion.
This market-capitalization estimate uses the latest filing share count supplied for this note; the actual count can change between filings.
Estimated trailing free-cash-flow yield: $136.683B ÷ approximately $5.051T = 2.7%. This is a calculated estimate, not a metric reported by Apple.
These figures suggest a substantial quality premium. They do not establish that Apple is definitively overvalued. They do indicate demanding expectations for ecosystem durability, Services growth, margins, free cash flow, AI integration, manageable China and regulatory exposure, and continued per-share compounding. Returns also depend on investors’ ongoing willingness to pay a premium multiple.
The higher the valuation, the less room there is for disappointment.
Multiple Compression Is a Real Risk
Apple could remain a strong business while the stock produces weaker returns if its valuation multiple contracts. That is a risk to evaluate, not an assumption that compression will occur.
Where Technicals and Fundamentals Agree
Revenue and Services are growing, margins are strong, cash generation is exceptional, the balance sheet remains resilient, and the share count is declining. Our assessment of the ecosystem economics remains favorable.
The bullish 4H, daily, and weekly trends, with price above the major moving averages, are broadly consistent with that business performance. Price strength supports the current technical assessment; it does not independently prove business quality.
Where They Conflict
The central tension is business quality versus valuation. A strong chart and strong operations can coexist with limited room for disappointment in the price.
The business can continue executing well while future returns become more dependent on valuation. That is the distinction between owning a great company and buying that company at an attractive price.
A strong business can justify a premium. It cannot justify any price.
What Would Change the Thesis?
Technical Conditions That Would Weaken the Setup
- Repeated failure around $351.73.
- Sustained loss of $338.70.
- A failed reclaim of the $339–$343 region.
- Persistent lower highs and lower lows.
- Loss of $326–$332 support.
These are signs of weakening price structure, not automatic sell signals. They do not by themselves establish deterioration in the business.
Fundamental Thesis Breakers
- Sustained deterioration in ecosystem retention.
- Persistent iPhone weakness without offsetting growth.
- Slowing Services growth combined with margin pressure.
- Material regulatory impairment of Services economics.
- AI failing to improve ecosystem value.
- Significant competitive deterioration or serious China deterioration.
- Materially weaker free-cash-flow conversion.
- Poor capital allocation.
- Sustained dilution rather than per-share compounding.
Bottom Line
Technical view:
Bullish trend, unresolved resistance test.
Fundamental view:
Strong.
Valuation view:
Demanding.
Key technical support is $338.70, then $326–$332. Key resistance is $351.73. Business strength rests on the ecosystem, Services, margins, free cash flow, brand, and capital allocation. The principal investment risks include valuation, regulation, China, AI execution, and dependence on sustained ecosystem strength.
Continued Services growth, durable margins, strong free cash flow, successful AI integration, retention, and per-share compounding would strengthen the thesis. Slowing growth combined with margin pressure, ecosystem erosion, regulatory impairment, weaker cash generation, or an elevated valuation while fundamentals decelerate would weaken it.
The business is strong.
The chart is strong.
The price demands that both remain strong.
Sources & Further Reading
Primary sources reviewed for this October 23, 2026 historical note. Financial-statement periods are identified in the text; calculations are Ripple’s estimates.
Position Disclosure
Apple securities may be held in personal and/or family accounts associated with Patrick Fagan.
References to "we," "our," or ownership are not references to client assets, a model portfolio, or securities managed for the public.
Standard Disclaimer
This Market Note is provided for educational and informational purposes only and does not constitute personalized investment advice, a recommendation to buy or sell any security, or a prediction of future performance.
Technical and fundamental analysis involve interpretation and may produce different conclusions depending on methodology, timeframe, assumptions, and market conditions.
Ripple Capital Partners LLC is not currently a registered investment adviser and does not provide personalized investment advisory or asset-management services.